Here is our mature product that you can also have. We set the price on Indiegogo for $ 1500, plus logistics. This means that it will only return production costs to us, but that is for a better world.

To be sure (but also to you) that the whole solution is indeed in line with our assumptions, we have prepared a whole set of tools to access data from sensors and peripherals.
We collected GB logs and then using the tools available on the Google Cloud paltform we prepared the entire analytics together with visualization.
We can confirm based on actual data. Solar Tracker actually increases the efficiency of the solar kit by a minimum of 30%.
The maximum increase in energy produced was 41%. Gradually we will explain in detail why this is possible - and why so (little)?
In addition, we hooked up to energy meters to see how we use electricity during the day and night. We used the house where 4 people live.
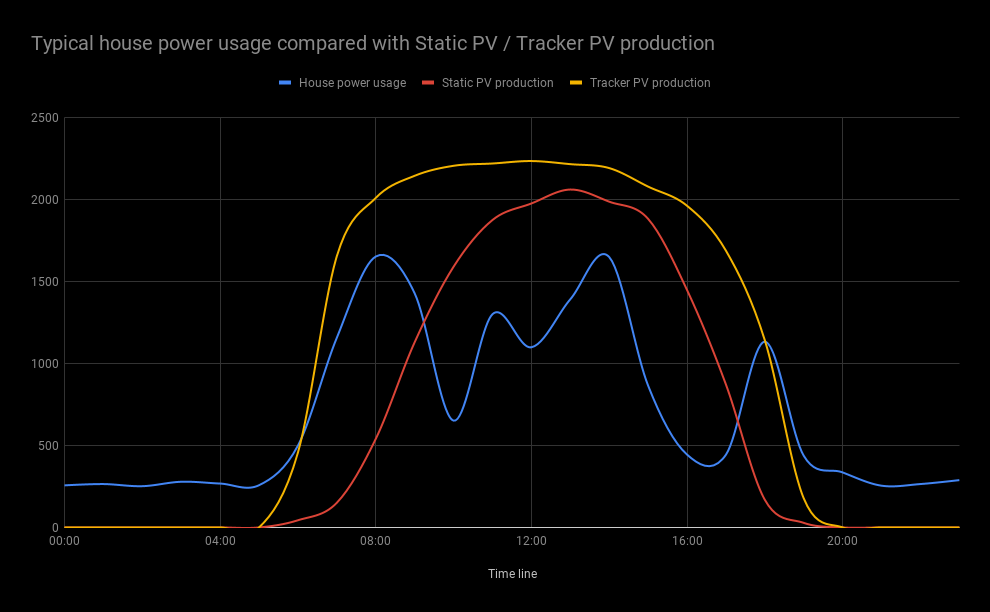
It shows how the powerconsumption is distributed along the day. (Blue line)
The line shape show clearly the weakness of stand still set. (Red line)
Quick start in the morning respond on real power demands. (Yellow line)
In Poland, energy companies do not buy energy from micro-producers. However, there is a procedure for the compensation of energy collected and delivered to the network. It works so that for every kWh of energy supplied, the consumer can download 0.8 kWh. 0.2kWh is taken against the cost of line service.
This is basically a good approach. For comparison, the losses in battery banks are much higher. The cost of building them high and power plants must somehow maintain transmission lines. we treat it as our "UPS" available as part of the subscription. This opens the eyes of many investors when they receive the first periodic billing.
Analyzing the collected data under the account of the actual capacity of building power directly from the PV panels, we compiled the graph as below.
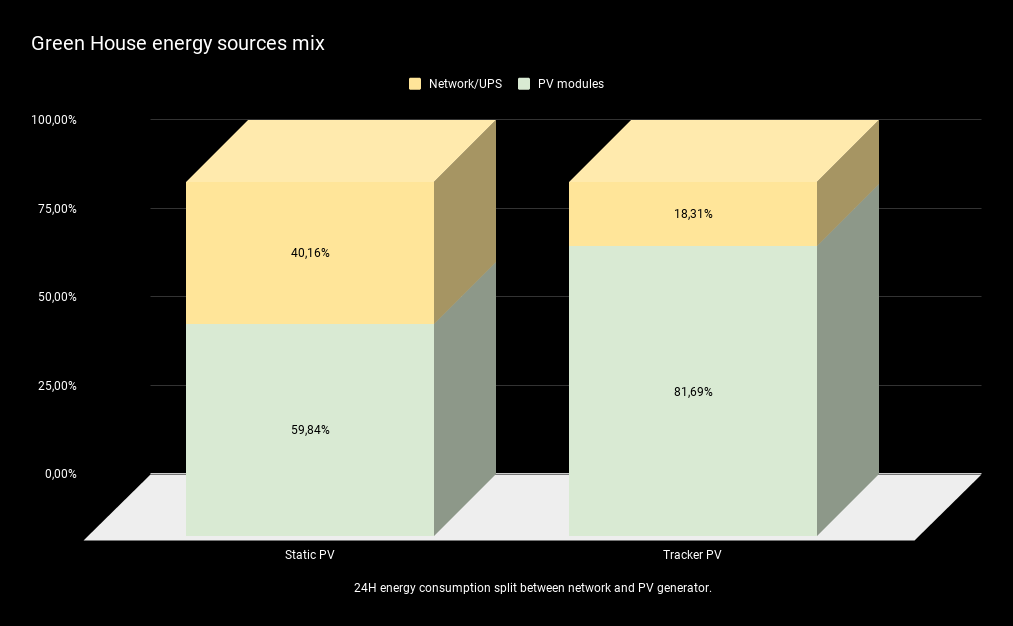
Depending on the availability of electricity from renewable sources. We're pulling more or less power from the network. It can also be a UPS or other source protecting us against a power outage. We want the PV modules to cover as much demand as possible during the day. We assume that both sets have the same nominal power:
Fixed solar modules are able to cover only ~ 60% of the daily requirement directly the remaining part has to be sent to the grid and then re-collected in the evening. This is because both in the morning and evening hours their performance is low. In addition, most households have lower energy demand at midday than the current power of panels.
Modules installed on the solar traker cover ~ 80% of the daily demand directly limiting the multiple flow of current to and from the grid to a minimum. We reduce the load on the cables, inverter and UPS controllers.
If we apply the billing policy described above, we will lose a lot of production for compensation, especially if we take into account differences in charging between the three phases in the installation.
If we install USP to ensure independence, our device will have to be much larger. In addition, the battery life depends on the number of charge and discharge cycles, so we will drain the device faster. In addition, there is an aspect of the efficiency of the UPS loading controller.
On the one hand, the consumer / investor is interested in the lifetime of the UPS, or whether it will have to give away as much energy in exchange for using the network as a warehouse.
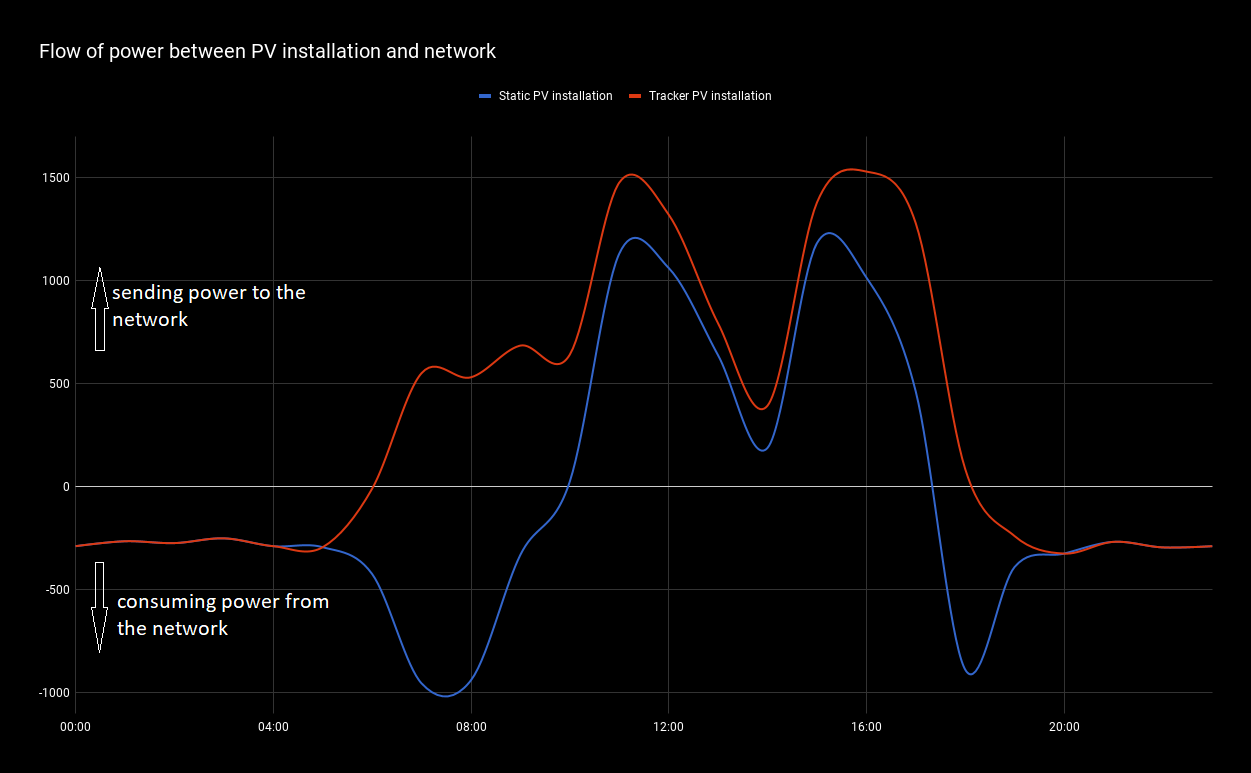
On the other hand, the majority of the energy industry is concerned about the abrupt load of the power grid. Below we show how the energy flow in the installation using the solar tracker and the still one is different.
Consider that - You can improve Your as is installation without changing the PV panels and inverter. And what is most important produce less waste in future.